300ms Faster: Reducing Wikipedia's Total Blocking Time
Have you ever been frustrated from interacting with a website that was slow to respond to your clicks or had jerky scrolling? Performance flaws like these can lead to the following:
For more than three years, Wikipedia's mobile site suffered from a piece of JavaScript that could take over 600ms to execute during page load on low-end devices, effectively blocking user interactions.
In this article, we'll walk through a couple of easy steps I took to reduce the execution time of this task by about 50%.
Total Blocking Time: Why long tasks matter
600ms of synchronous JavaScript execution may not sound like a long time, but imagine if a user tried to click a button during page load when the JavaScript began executing. Because only one task can be processed on the browser's main thread at any given time, the user would need to wait for the following steps to finish before they see a visual update:
- The 600ms JavaScript task executes
- The relevant click handler task executes
- The browser performs the necessary rendering steps to update the page visually

Each step takes time, and the user can perceive any interaction that takes longer than 100ms to produce a visual update as slow. Because of this, Google considers any task that takes more than 50ms a "long task" that can affect the page's responsiveness to user input. They even developed a metric for this called "Total Blocking Time" (TBT).

What is Total Blocking Time?
TBT measures the sum of the blocking portion of all long tasks on the browser's main thread between First Contentful Paint (FCP) and Time to Interactive (TTI). The "blocking portion" is the time after 50ms of each long task.
Let's try calculating the TBT in the example below:

- The 80ms task is 30ms longer than 50ms so contributes 30ms to TBT.
- The 30ms task doesn't contribute to TBT since it is less than 50ms and NOT a long task.
- The 100ms task is 50ms longer than 50ms so contributes 50ms to TBT.
Since TBT is the sum of the time exceeding 50ms of each long task, the TBT for this example is 30ms + 50ms = 80ms.
When tested on average mobile hardware, Google recommends sites have a TBT of less than 200 milliseconds. But Wikipedia had one task that could take over 600 milliseconds — roughly 3x the recommended TBT limit for this one task alone.
How do we improve TBT?
How to reduce Total Blocking Time
To decrease TBT, we need to either:
- Do less work on the main thread between First Contentful Paint and Time to Interactive
- Do the same amount of work, but break up long tasks into smaller tasks that don't exceed 50ms
This article focuses on making gains from the first bullet point.
Step 1: Remove unnecessary JavaScript
While many things run on the main thread, including HTML parsing, paints, and garbage collection, long JavaScript execution is frequently the culprit of TBT problems. After all, JavaScript is the fastest way to slow down a site.
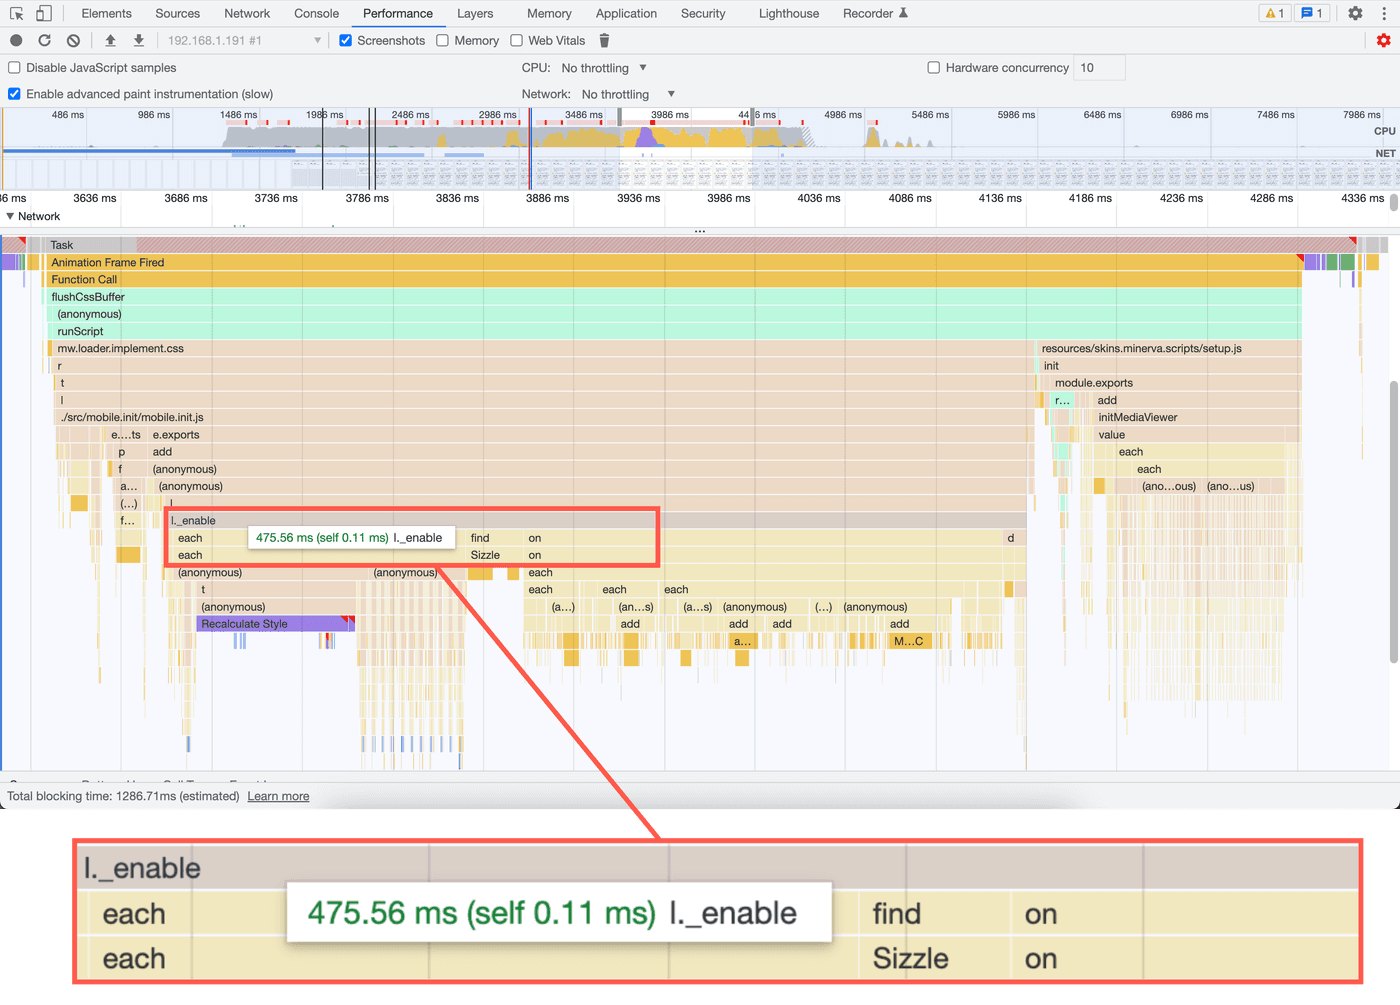
When I profiled Wikipedia's mobile site, I found that an _enable method
was responsible for most of the execution time. This method initialized the
mobile site's section expansion and collapsing behavior. The profile also
showed that, within the _enable method, a call to jQuery's .on("click")
method was slow.
function _enable( $container, prefix, page, isClosed ) { ... // Restricted to links created by editors and thus outside our // control T166544 - don't do this for reference links - they will // be handled elsewhere var $link = $container.find("a:not(.reference a)"); $link.on("click", function () { // the link might be an internal link with a hash. if it is check // if we need to reveal any sections. if ( $link.attr("href") !== undefined && $link.attr("href").indexOf("#") > -1 ) { checkHash(); } }); util.getWindow().on("hashchange", function () { checkHash(); });}The .on("click") call attached a click event listener to nearly every
link in the content so that the corresponding section would open if the
clicked link contained a hash fragment. For short articles with few links,
the performance impact was negligible. But long articles like
"United States" included
over 4,000 links, leading to over 200ms of execution time on low-end
devices.
Worse yet, this behavior was unnecessary. The downstream code that
listened to the hashchange event already called the same method that the
click event listener called. Unless the window's location already pointed
at the link's destination, clicking a link called the checkHash method
twice — once for the link click event handler and once more for the
hashchange handler.
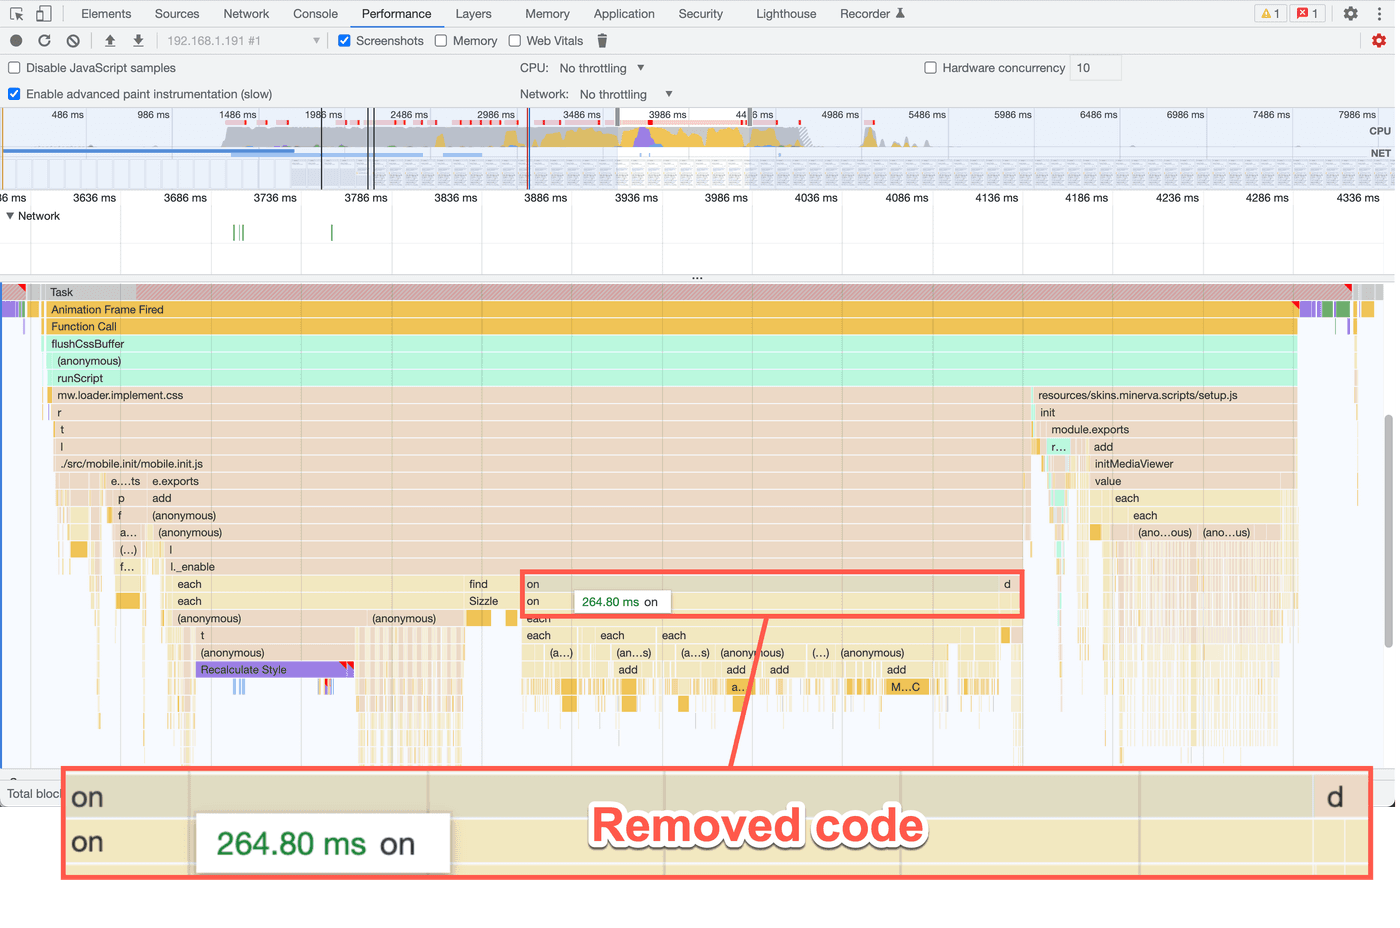
Therefore, in this case, the best approach was to simply remove this block of JavaScript and free up nearly 200ms from the main thread with virtually the same functionality.
When profiling, always check where the most time is spent. Then, see if there is code you can either optimize or, better yet, remove.
Remember, one of the fastest ways to speed up a site is to remove JavaScript.
Step 2: Optimize existing JavaScript
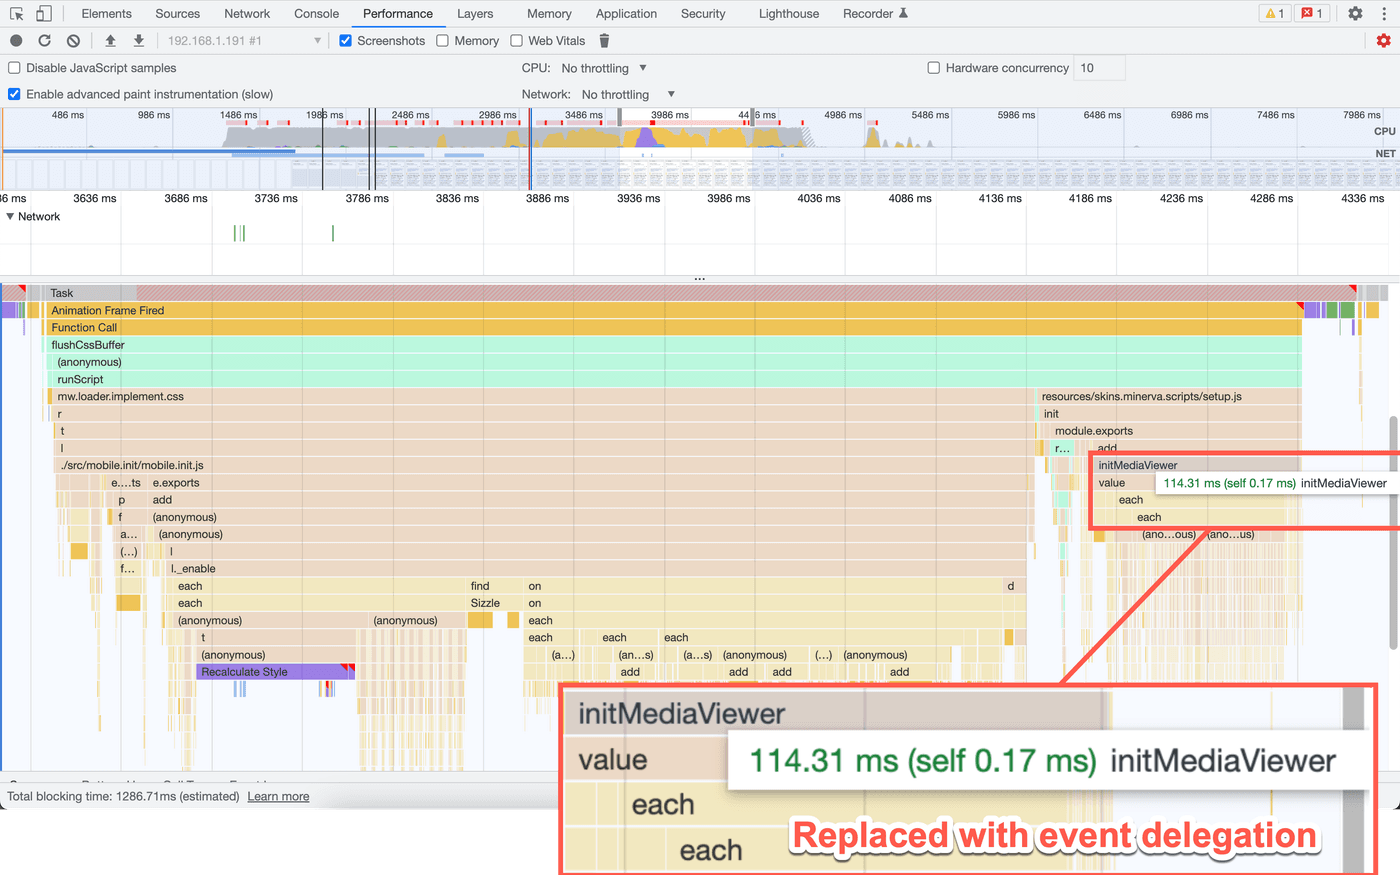
An additional performance review revealed that an initMediaViewer method
took ~100ms to execute . This method was responsible for attaching a click
event listener to each thumbnail in the content so that a click to a
thumbnail would open a media viewer:
/** * Event handler for clicking on an image thumbnail * * @param {jQuery.Event} ev * @ignore */function onClickImage(ev) {  ev.preventDefault();  routeThumbnail($(this).data("thumb"));}
/** * Add routes to images and handle clicks * * @method * @ignore * @param {jQuery.Object} [$container] Optional container to search * within */function initMediaViewer($container) {  currentPageHTMLParser    .getThumbnails($container)    .forEach(function (thumb) {      thumb.$el.off().data("thumb", thumb).on("click", onClickImage);    });}
Similar to the link example in step 1, attaching an event listener to each thumbnail on the page doesn't scale well. Editors of Wikipedia articles can (and do) make articles with thousands of images. When this block of code ran, it could take well over 100 milliseconds to execute for pages with a lot of images and increase the TBT of the page. What is an alternative approach?
Use event delegation.
Event delegation is a powerful technique that lets us attach a single event listener to an element that is the common ancestor of many elements. Using event delegation is often more efficient when dealing with user-generated content that could add any number of elements. It takes advantage of event bubbling and works like this:
- Attach an event listener to a container element.
- Using the
eventparam in the event handler, check theevent.targetproperty to see the source of the event. Optionally use theevent.target.closest(selector)API to check for an ancestor element. - If the source of the event is an element or the child of an element we're interested in, handle it.
The updated code looked like the following:
/** * Event handler for clicking on an image thumbnail * * @param {MouseEvent} ev * @ignore */function onClickImage(ev) {  var el = ev.target.closest(PageHTMLParser.THUMB_SELECTOR);  if (!el) {    return;  }
  var thumb = currentPageHTMLParser.getThumbnail($(el));  if (!thumb) {    return;  }
  ev.preventDefault();  routeThumbnail(thumb);}
/** * Add routes to images and handle clicks * * @method * @ignore * @param {HTMLElement} container Container to search within */function initMediaViewer(container) {  container.addEventListener("click", onClickImage);}
In this case:
- I revised the
initMediaViewermethod to attach one click event listener to a single container element that contained all the images. - In the
onClickImagemethod, I used theev.target.closest(selector)API to check if the click originated from a thumbnail or a child of a thumbnail element. If it didn't, the code returns early since we only care about clicks to thumbnails. If it did, the code handles the event.
But what were the results of this work?
Conclusion
We released the optimizations outlined in steps 1 and 2 to production in two deploys — step 1 followed by step 2.
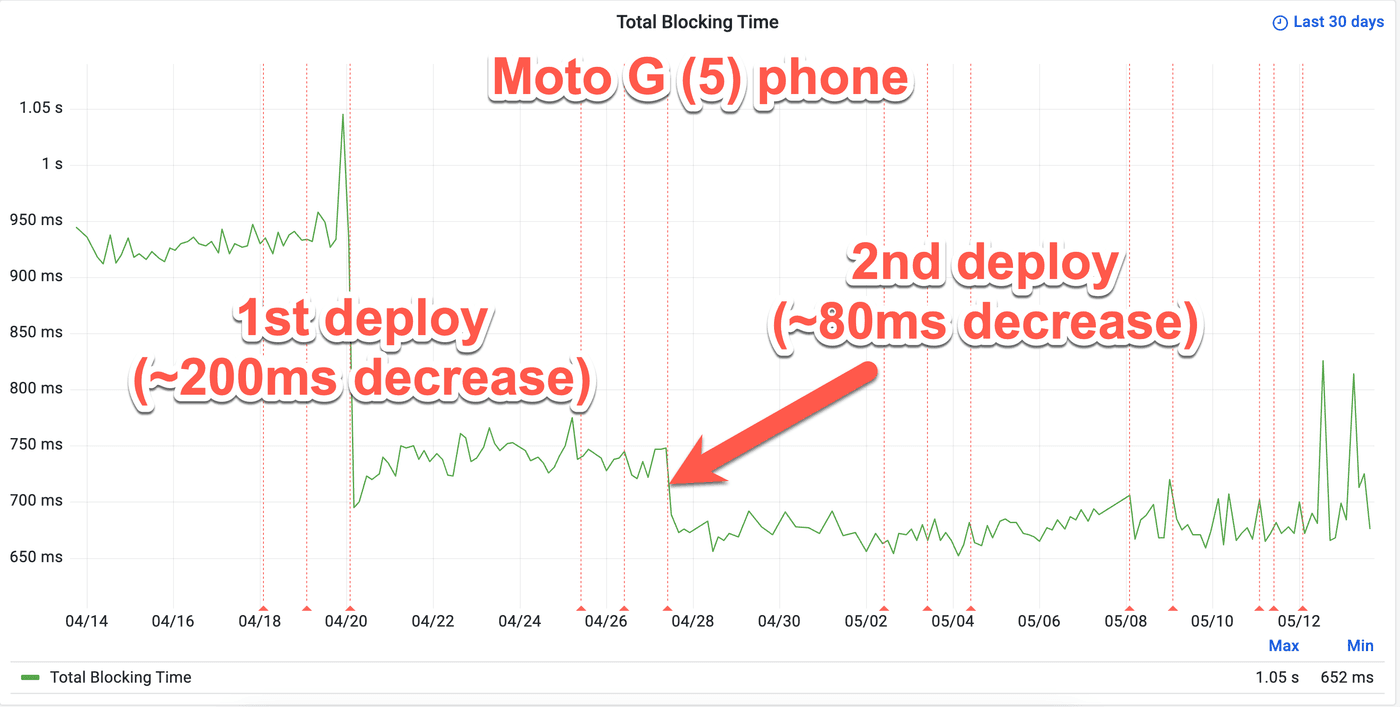
According to Wikipedia's synthetic performance test data, the first deployment resulted in a reduction of TBT by approximately 200ms, while the second deployment improved TBT by around 80ms when testing on a real Moto G (5) phone. Overall, these two steps reduced TBT by nearly 300ms on devices like the Moto G (5) phone visiting long articles.
Wikipedia's real user monitoring (RUM) also improved in long task duration.
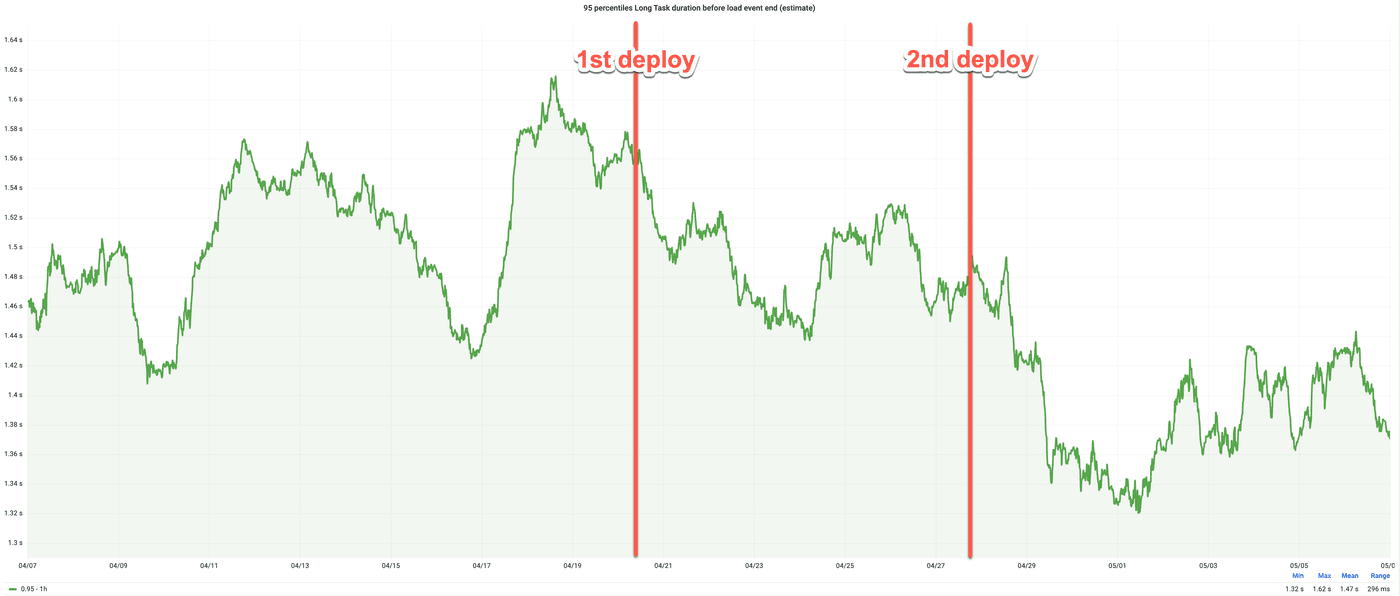
While there is still room for further improvement, with the task still exceeding the recommended limit on low-end devices, the progress made so far is significant. To achieve even greater reductions in TBT, it may be necessary to break up the task into smaller tasks.
What this experience demonstrates is that significant performance improvements can be achieved through small, targeted optimizations. By removing or optimizing specific sections of code, even seemingly minor changes can have a substantial impact on a website's overall performance. It serves as a reminder that delivering a more responsive browsing experience that can work on any device doesn't always require complex and extensive changes to the codebase. Sometimes, it's the smaller wins that make the biggest difference.
