Interaction to Next Paint (INP): Everything You Need to Know
Interaction to Next Paint (INP) will become the next Core Web Vital on March 2024, replacing First Input Delay (FID) as the metric that measures how quickly a page responds to user interactions. Currently, 35.1% of mobile websites fall short of Google's latest web performance standard.
The percentage of mobile website origins with failing INP scores (> 200 ms) as of May 2023. Source: HTTP Archive
About 90% of a user's time on a webpage happens after it loads. Users expect that when they interact with a page by clicking a button, tapping a menu item, or pressing a key, visual feedback happens — and occurs quickly. INP captures this latency and flags interactions that are slow enough to cause a negative user experience.
Fast interactions are essential for user happiness and business success:
- Rage clicking is one side effect of poor INP
- redBus increased sales by 7% after improving their INP
- The Economic Times decreased bounce rate by 50% and increased pageviews by 43% by reducing INP nearly 4x
In this article, you will learn about INP and how to optimize it for your website to provide your users with smooth interactions.
What is Interaction to Next Paint (INP)?
INP is a metric that evaluates how quickly a page visually responds to specific user interactions. It measures the latency of clicks, taps, and keypresses to produce visual updates.

For example, when you:
- Click a menu button, INP measures how long it takes for the menu to appear.
- Tap the close button of a modal, INP measures how long it takes for the modal to disappear
- Press a key into an input field, INP measures how long it takes for that character to appear in the field
As a Core Web Vital, INP measures a critical aspect of a user's experience — interactivity and responsiveness. Google will use INP as a page experience signal that influences your website's search ranking.
What is the difference between First Input Delay (FID) and INP?
The INP metric is FID's successor, replacing it as a Core Web Vital on March 2024. Although both metrics measure a page's interactivity and responsiveness, INP provides a more comprehensive assessment of a user's experience in two important ways:
- INP observes all interactions throughout the lifetime of a page, while FID only measures the first interaction
- INP measures the time it takes from the start of the interaction to the moment the first frame appears, while FID only measures the time it takes for the browser to be able to respond to the interaction (input delay portion)

Part of the reason why websites rarely had poor FID scores was because it only measured the input delay portion of the user's first interaction. Because INP measurement includes the moment a visual change occurs, it's a better indicator of user experience.
Websites have worse INP scores compared to FID, particularly on mobile devices. As of May 2023, 99.9% of desktop sites and 93.2% of mobile sites passed FID, compared to 96.6% of desktop sites and just 64.9% of mobile sites passing INP.
How is INP measured?
During a user's visit to a web page, INP measures the time elapsed between every click, tap, and keypress until a visual change occurs. This elapsed time represents the interaction's latency. When the user leaves the page, the INP score is calculated based on one of the recorded interaction latencies.

Most of the time, INP is equal to the page's longest interaction latency. There's an exception, however, when a user performs 50 or more interactions on a page (as can often happen with single-page applications). In this case, INP will ignore one interaction for every 50 interactions in an effort to reduce random outliers. So, for example, when a user views a page:
- If there are 49 interactions, INP will be the slowest interaction
- If there are 50 interactions, INP will be the second slowest interaction
- If there are 99 interactions, INP will still be the second slowest interaction
- If there are 100 interactions, INP will be the third slowest interaction
As with other Core Web Vitals, the 75th percentile of all page views is reported, further reducing noise.
Notably, the visual update doesn't need to be the final visual state. INP is only concerned with the time it takes to present the next frame after an interaction. The frame can be an intermediate state like a spinner or progress bar. As long as the interaction results in timely visual feedback that shows the user something has happened, you can get good INP scores. For the best user experience, use the appropriate progress indicator for the situation.
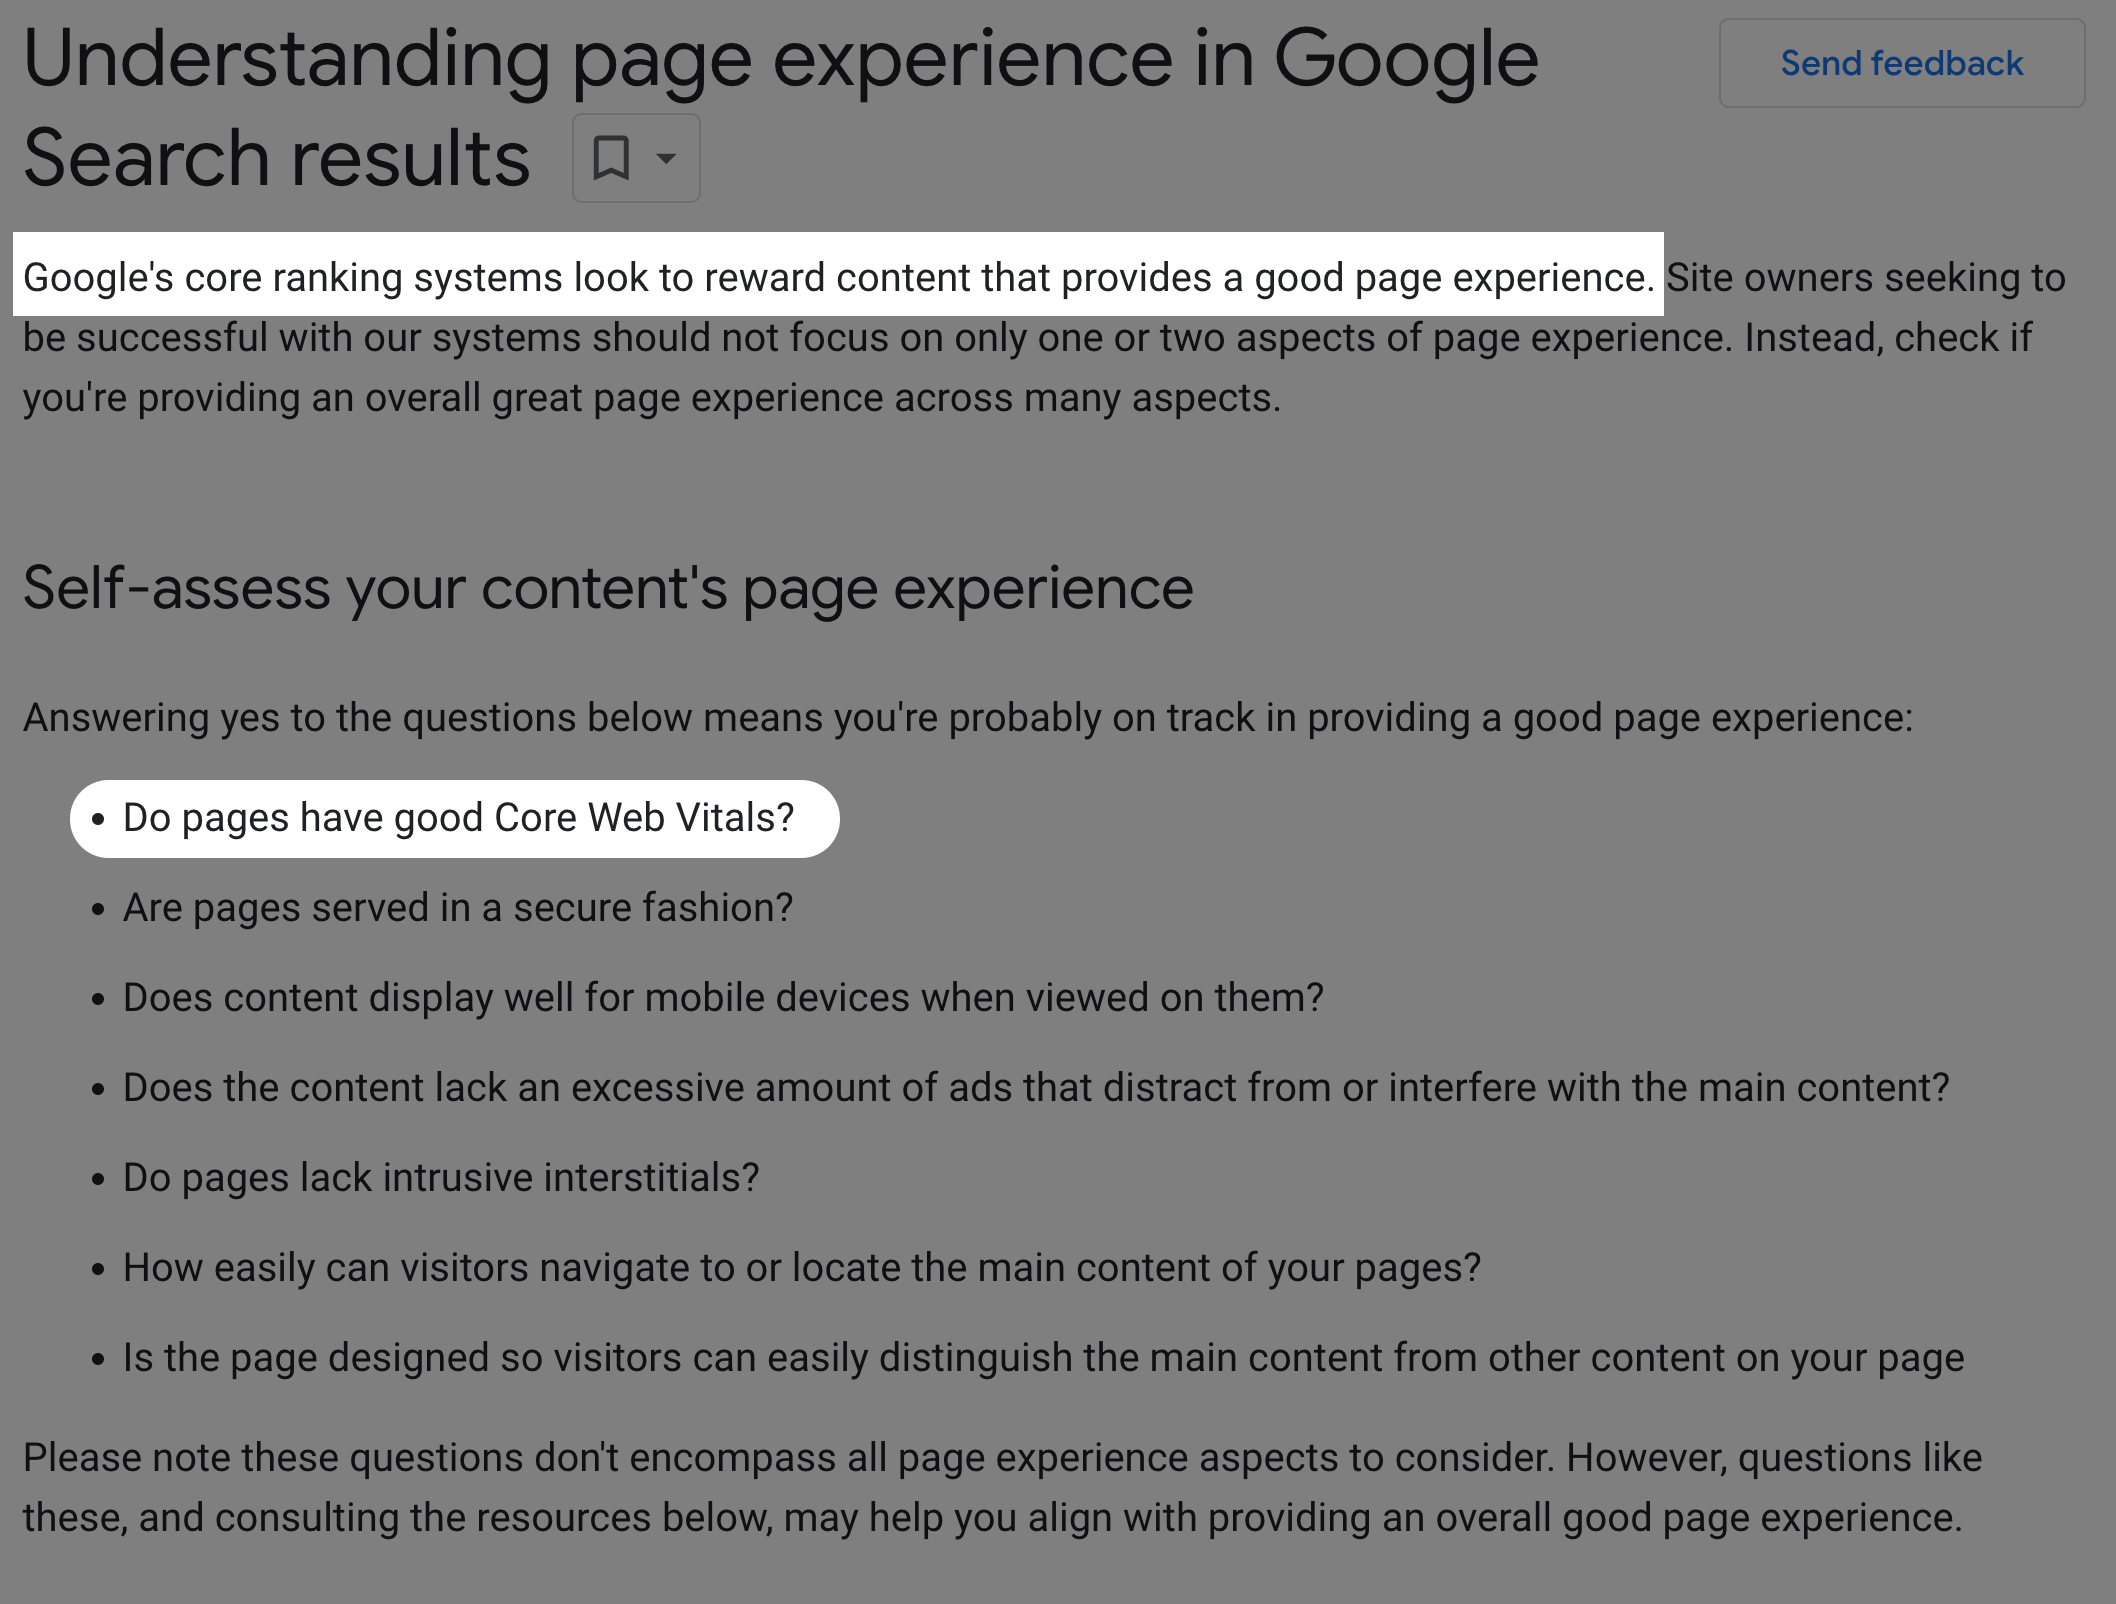
What's a good INP score?
At the 75th percentile for any given page and segmented across desktop and mobile devices:
- INP <= 200 milliseconds indicates a page has good responsiveness
- INP <= 500 milliseconds indicates a page needs improvement
- INP > 500 milliseconds indicates a page has poor responsiveness

What interactions does INP measure?
INP measures the following interactions:
- Mouse clicks
- Taps on touchscreens
- Keypresses (physical and onscreen)
It does NOT measure:
- Hovering
- Scrolling
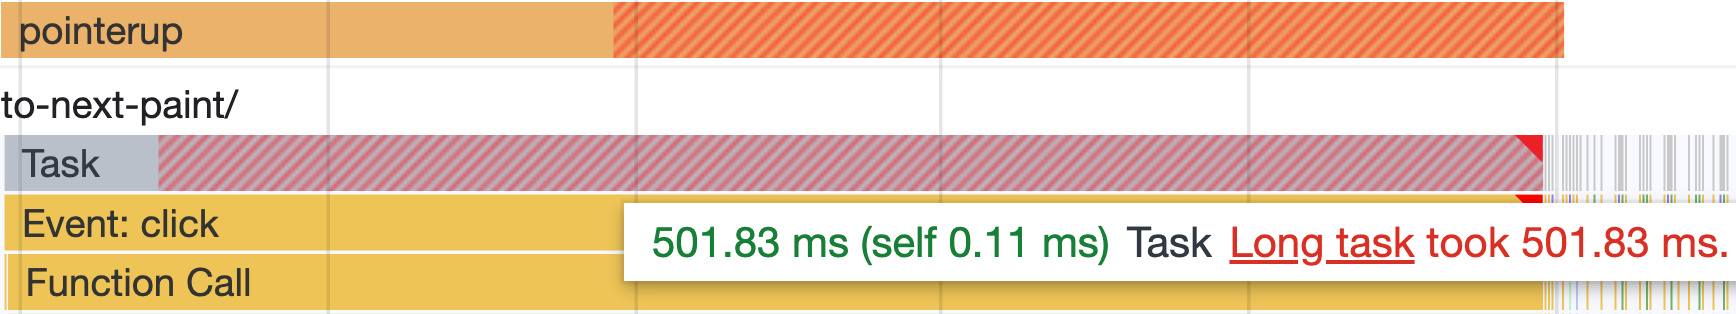
What can happen during an interaction?
INP contains three critical phases:
- Input delay: Begins when a user clicks, taps, or presses a key and ends when the first JavaScript event callback starts executing
- Processing time: The total execution time of the event callbacks
- Presentation delay: Begins when the last event callback completes and ends when a visual update occurs

Each of these phases adds time to the latency of an interaction.
How to measure INP
Since INP requires interactions with the page, the best way to measure it is with real users through Real User Monitoring (RUM). Usually, this involves adding a small piece of JavaScript to your website that tracks the responsiveness of each interaction on a page (PageSpeed Insights is a notable exception).
You can use one of the following tools:
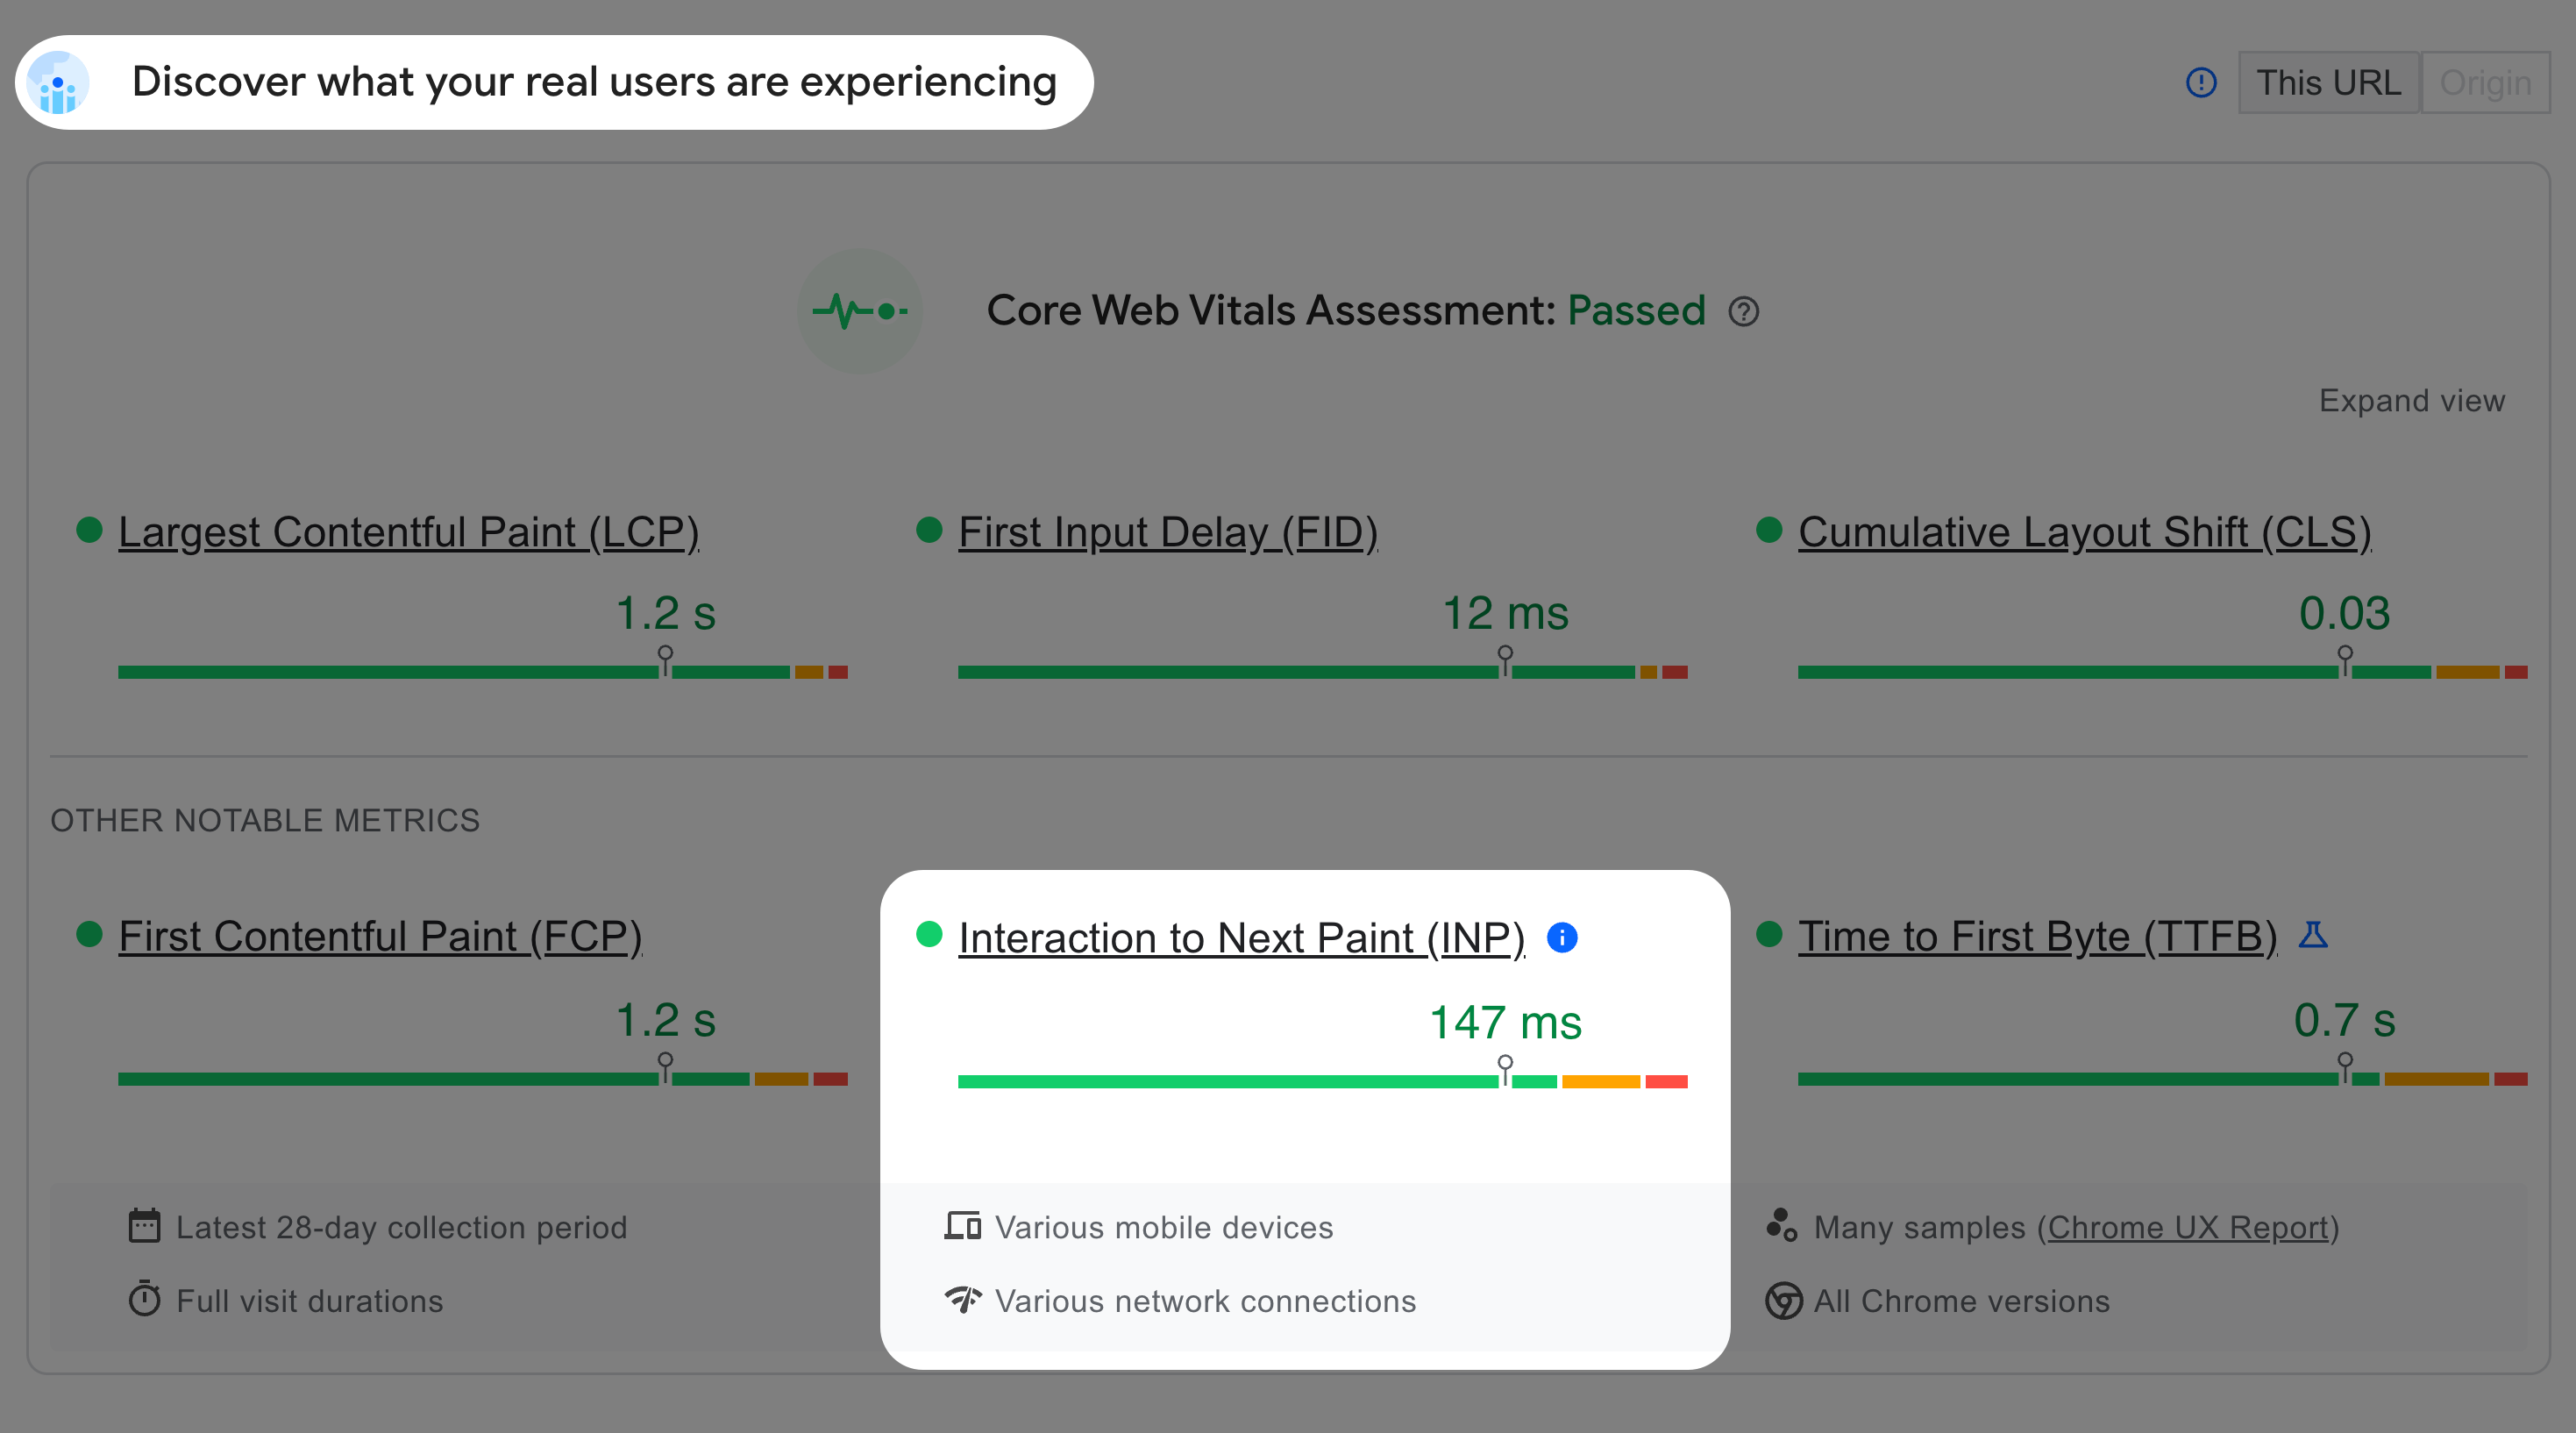
PageSpeed Insights (PSI)
If your site has enough traffic, you may be able to use data from Google's Chrome UX Report (CrUX) to get a rough idea of the interaction latency your users are experiencing. Using CrUX data can be a convenient option because it doesn't require adding any tracking script to your website. Instead, Chrome collects this data from eligible users and eligible pages automatically.
Google's PageSpeed Insights (PSI) tool is one tool that makes this data easily accessible. Enter a URL and click the Analyze button. Then, look at the "Discover what your real users are experiencing" section.
When using this PageSpeeds Insights, you should be aware of the following:
- The displayed data is aggregated for the most recent 28 days of data
- There may be insufficient data for the page you're testing. If there isn't sufficient data for the page you've entered, PSI will try to use data from all pages of the website's origin instead. PSI won't show any data if the origin doesn't have enough data.
web-vitals JavaScript Library
Google released an open-source JavaScript library that lets you measure core web vitals (including INP) from real users. To use it, you'll need to install it from npm:
npm install web-vitalsThen, import the attribution build into your project so that you can
get more details about the interaction:
import { onINP } from "web-vitals/attribution";

function sendToAnalytics(metric) {
  // Instead of logging the output as done below, send desired data to
  // an analytics provider.
  console.log(metric);
}

onINP(sendToAnalytics);
The above example produces the following output when the page unloads:
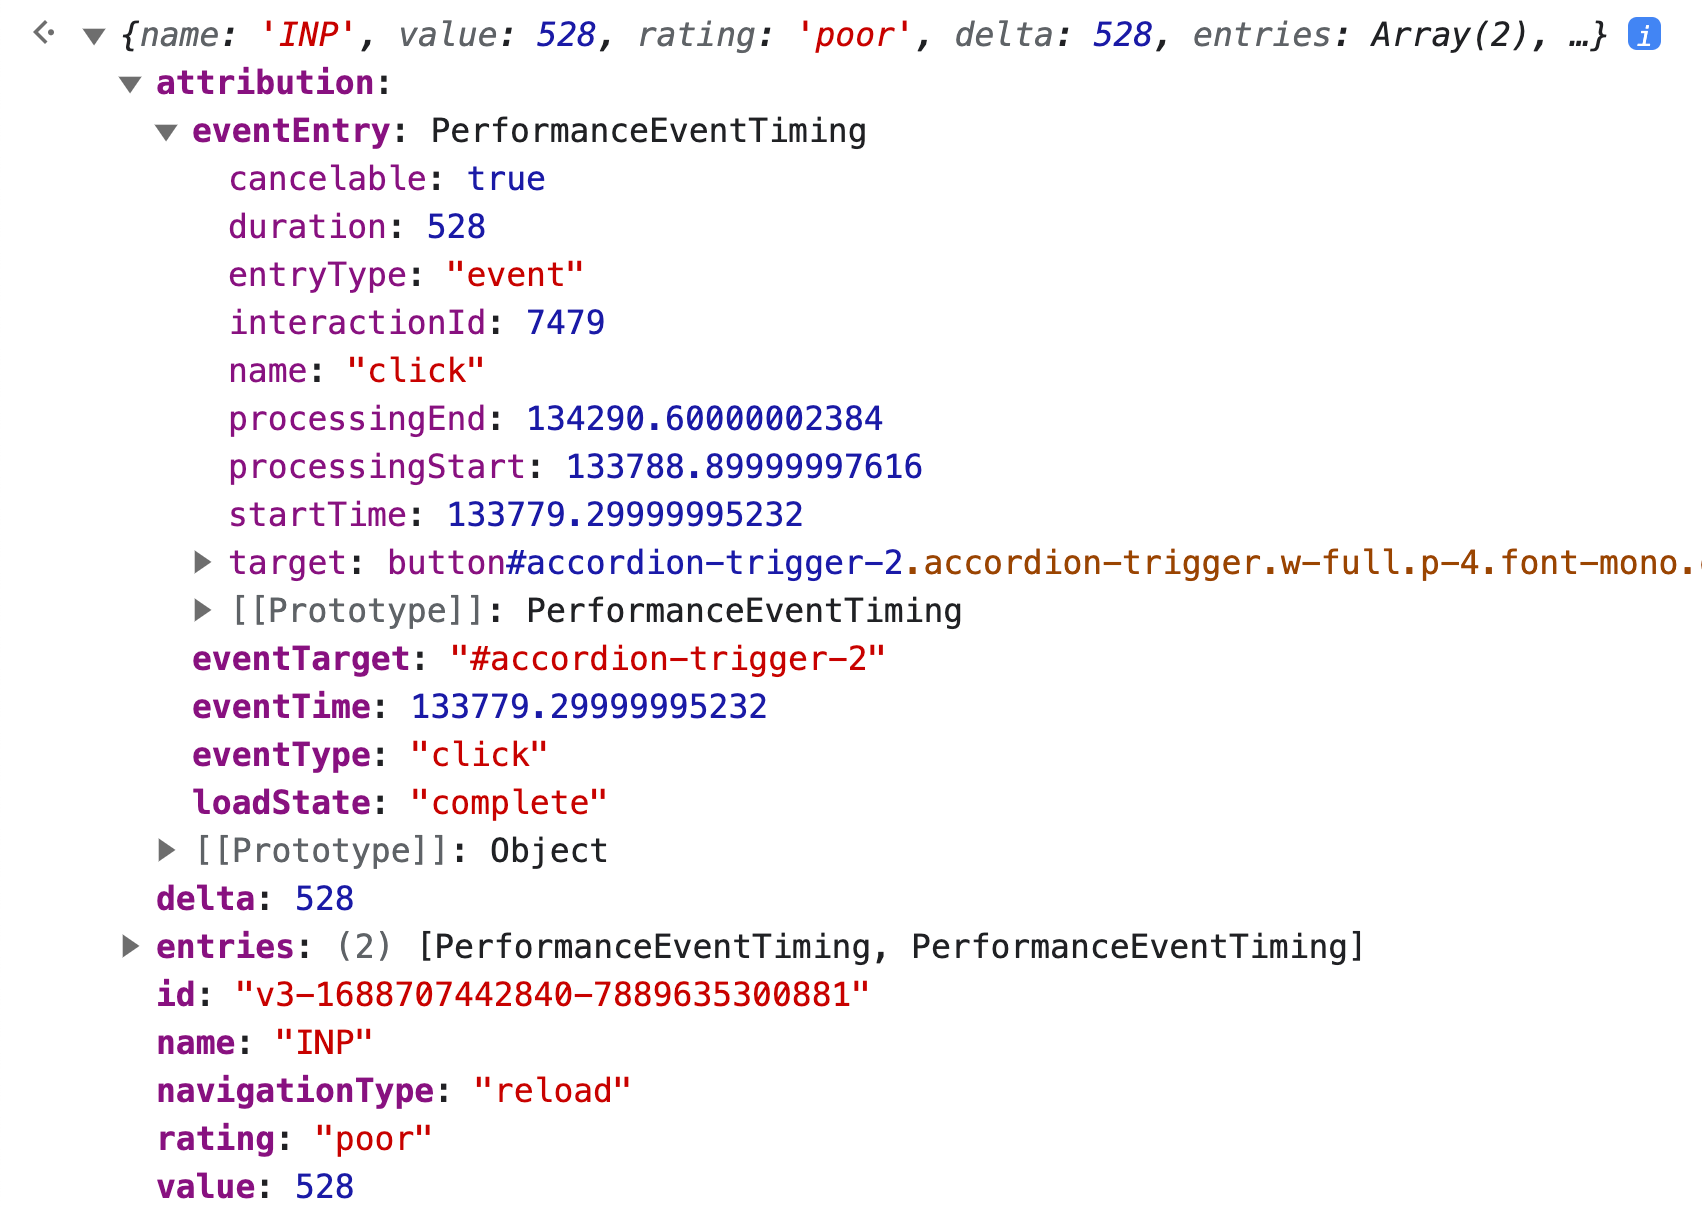
Importing the web-vitals/attribution adds an
attribution.eventEntry object, which you can use to derive the
input delay, processing time, and presentation delay:
startTime: Time in milliseconds at which the interaction occurred.processingStart: Time at which event callbacks started executing. The input delay isprocessingStart - startTime.processingEnd: Time at which event callbacks finished executing. Theprocessing timeduration isprocessingEnd - processingStart.duration: Total duration of interaction rounded to the nearest 8 ms. Thepresentation delayisstartTime + duration - processingEnd.
You'll want to send this and other information contained in the object to your analytics provider.
What causes slow interactions?
The main reason for slow interactions are long tasks — tasks that take 50 ms or longer — on the browser's main thread. These tasks refer to discrete units of work carried out by the browser, including:
- HTML parsing: Converts raw HTML into a DOM tree
- Style and layout: Matches elements to selectors, calculates computed styles, determines visual geometry of elements
- Painting: Records a list of drawing instructions
- JavaScript: Makes websites interactive
- Garbage collection: Reclaims memory
Any of these can be responsible for a slow task.
The browser's main thread can only execute one task at a time, and that task must run to completion before another task can start. Devices with lower hardware capabilities, such as mobile phones with slower CPUs, are more likely to have responsiveness issues because tasks take longer to complete. That's why it's a good idea to test interactions on devices that resemble the lower-end devices used by most of your users.

If you have a poor INP score, long tasks on the main thread are likely the primary cause.
How to fix INP
Since INP involves three phases, each interaction has three opportunities to be slow. Let's examine some of the most common reasons why input delay, processing time, and presentation delay can become sluggish and what you can do about it.
Optimize Input delay
The first part of each interaction always involves a small, often unnoticeable, delay that involves converting the interaction into an event that the browser understands. Once the browser determines the events associated with an interaction, it can run any registered event callbacks — unless there is a task blocking that from happening.

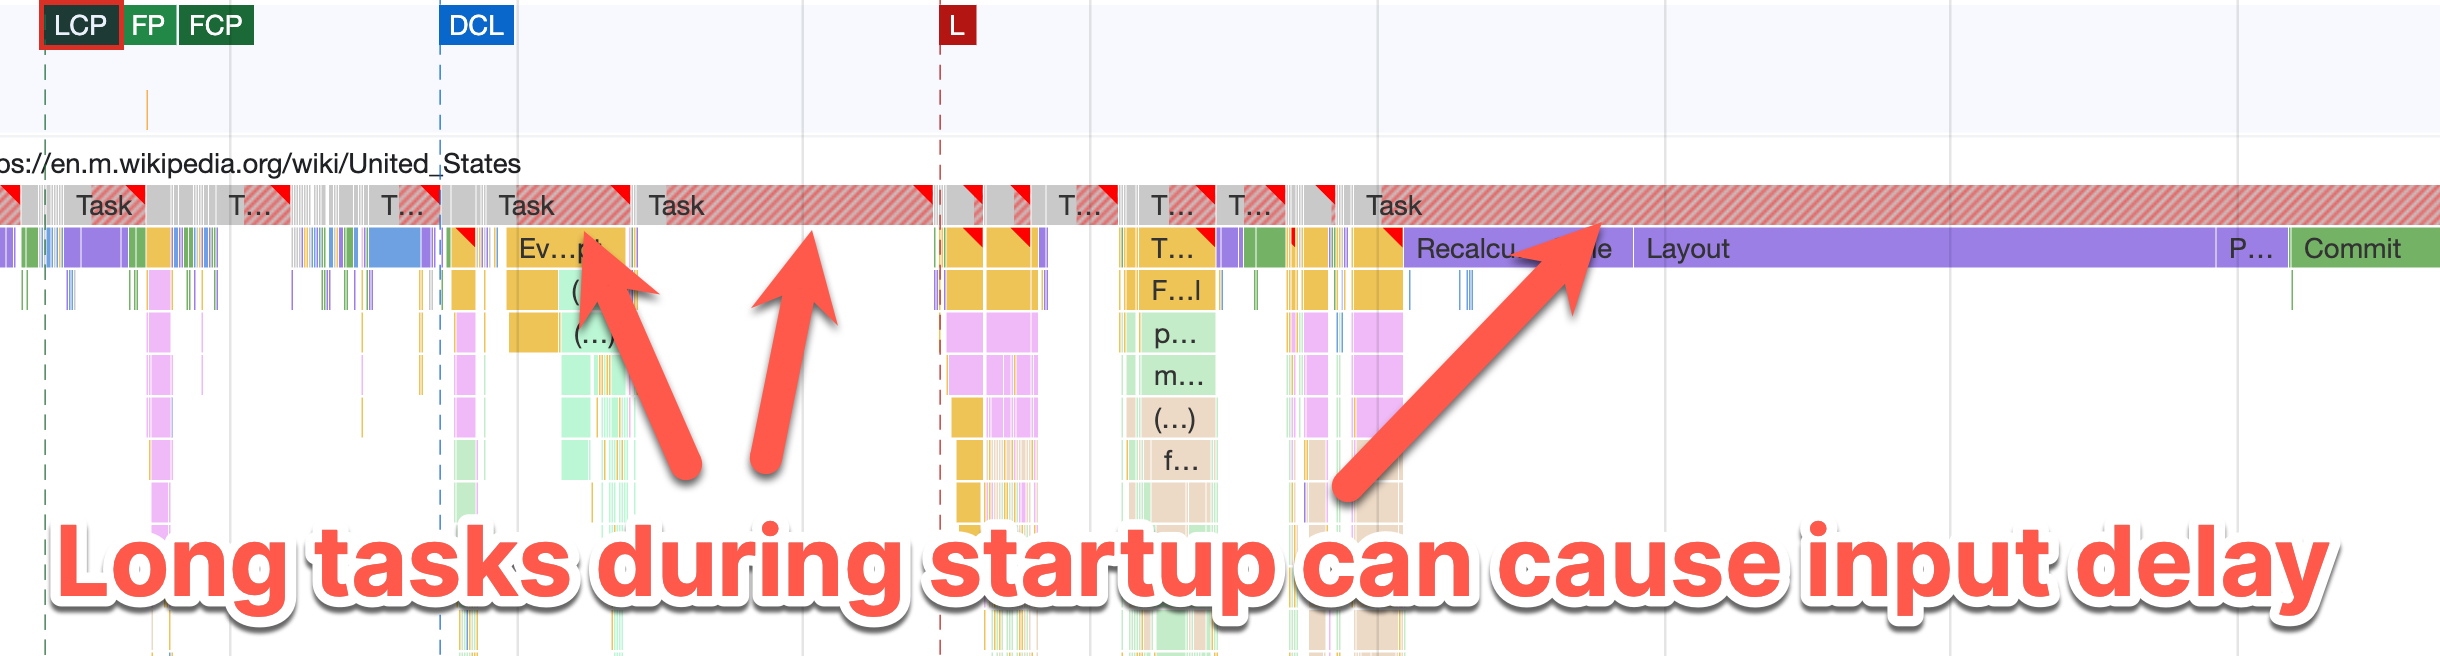
Long tasks during page startup
The main thread is often the most congested when a page loads and initializes. The browser parses HTML, evaluates scripts, renders, and paints during this time.
While there can be a variety of causes for these long tasks, some common culprits include:
- A single
<script>tag (without thetype=moduleattribute) that loads a huge amount of JavaScript. Since each<script>kicks off a task that evaluates the JavaScript once loaded, it can become problematic if the evaluation takes a long time. Instead, first try to reduce the amount of JavaScript you are loading. Then, consider having multiple script tags so that each one kicks off its own smaller task. Also, consider executing expensive logic in a web worker. - JavaScript that creates or mutates large DOM trees. Pages with a lot of elements can lead to very costly rendering tasks. Instead of using JavaScript to mutate the DOM during startup, try to make your server generate the HTML needed by the page.
Rapid interactions
Interactions that occur rapidly, like typing into an autocomplete field, can cause a high input delay for subsequent interactions.

First, try to reduce the callback's JavaScript logic as much as possible. Then, to avoid problems that can arise from the accumulation of small callbacks:
- Debounce input handlers
- Cancel any pending
xhrorfetchrequests
/**
 * An example showing how to debounce input events and cancel pending
 * fetch requests to avoid a high input delay from rapid input events.
 */
const input = document.querySelector("input");
let controller;
let signal;
let timeoutId;

const handler = async (e) => {
  // Cancel any pending requests.
  if (controller) {
    controller.abort();
  }

  controller = new AbortController();
  signal = controller.signal;

  try {
    const response = await fetch(`?q=${e.target.value}`, {
      signal,
    });
    // ...remaining callback logic
  } catch (err) {
    if (err.name === "AbortError") {
      // Ignore "errors" from canceled requests.
      return;
    }

    throw err;
  }
};

input.addEventListener("input", (e) => {
  // Cancel any pending callbacks.
  clearTimeout(timeoutId);

  // Wait 50 ms before executing callbacks.
  timeoutId = setTimeout(() => handler(e), 50);
});
Inefficient animations
When animating elements, try to only animate transform and opacity
CSS properties so the
animation doesn't run on the main thread,
which can cause an input delay.
Optimize processing time
Slow event callbacks will mitigate any positive effects of an optimized input delay. Fortunately, you can make optimizations to ensure this doesn't happen.

Long tasks from JavaScript execution
Inefficient JavaScript results in long tasks on the main thread that delay important rendering updates.
How do we solve this?
First, investigate the JavaScript responsible for the long task and see if there is any low-hanging fruit. Sometimes, this will reveal unnecessary JS that can be removed or inefficient JS that can be optimized. You may also be able to move some JavaScript off the main thread with Web Workers, which will free up the main thread to handle interactions.
After reducing JavaScript work, the next best option is to yield to the main thread. Split up the work into smaller tasks that each take less than 50 ms to execute. And prioritize the work that is user-facing. The benefits of doing this are two-fold:
- It allows the browser to render user-visible work as quickly as possible in the next frame, providing the user with fast visual feedback that something has happened.
- Deferring non-essential work to another task in a
setTimeoutcallback allows the main thread to handle higher priority tasks like subsequent user input before thesetTimeoutcallback is executed. Alternatively, you could userequestIdleCallback, but note that it has much less browser support.
accordion.addEventListener("click", (event) => {
  // Critical user-visible work that needs to happen before next
  // frame.
  toggleSection(event);

  // Defer less important work to the next frame in another task.
  requesetAnimationFrame(() => {
    setTimeout(() => {
      updateAnalytics(event);
    });
  });
});
Layout thrashing
The order of your JavaScript calls can dramatically influence how long it takes to execute.
If your JS reads layout properties after modifying styles, the browser needs to perform a forced synchronous layout to determine the updated layout metrics.
// Write
section.classList.add("expanded");
// Read (causing a forced synchronous layout)
section.scrollHeight;
This order becomes particularly expensive if you invoke multiple forced synchronous layouts before the browser presents a frame. When this happens, it's called “layout thrashing" and can significantly increase processing time. Layout thrashing often happens when a read and write are inside a loop:
const sections = documet.querySelectorAll("section");

// Each iteration causes a forced synchronous layout resulting in
// layout thrashing.
sections.forEach((element) => {
  // Write
  section.classList.add("expanded");
  // Read (causing a forced synchronous layout)
  section.scrollHeight;
});
To eliminate forced synchronous layouts and layout thrashing, perform all reads before any writes:
const sections = documet.querySelectorAll("section");

// Perform all reads first.
sections.forEach((element) => {
  // Read
  section.scrollHeight;
});

// Then perform all writes.
sections.forEach((element) => {
  // Write
  section.classList.add("expanded");
});
Optimize presentation delay
The last phase that can go wrong is the presentation delay portion which involves rendering and presenting the visual changes. It's also one of the most challenging phases to optimize.

Large DOM size
Significant presentation delays are often the result of large DOM trees — pages with more than ~1,400 nodes. The rendering work that the browser must do to produce a frame correlates with the size of the DOM.
Generally, the larger the DOM size, the longer it takes for the browser to render updates.
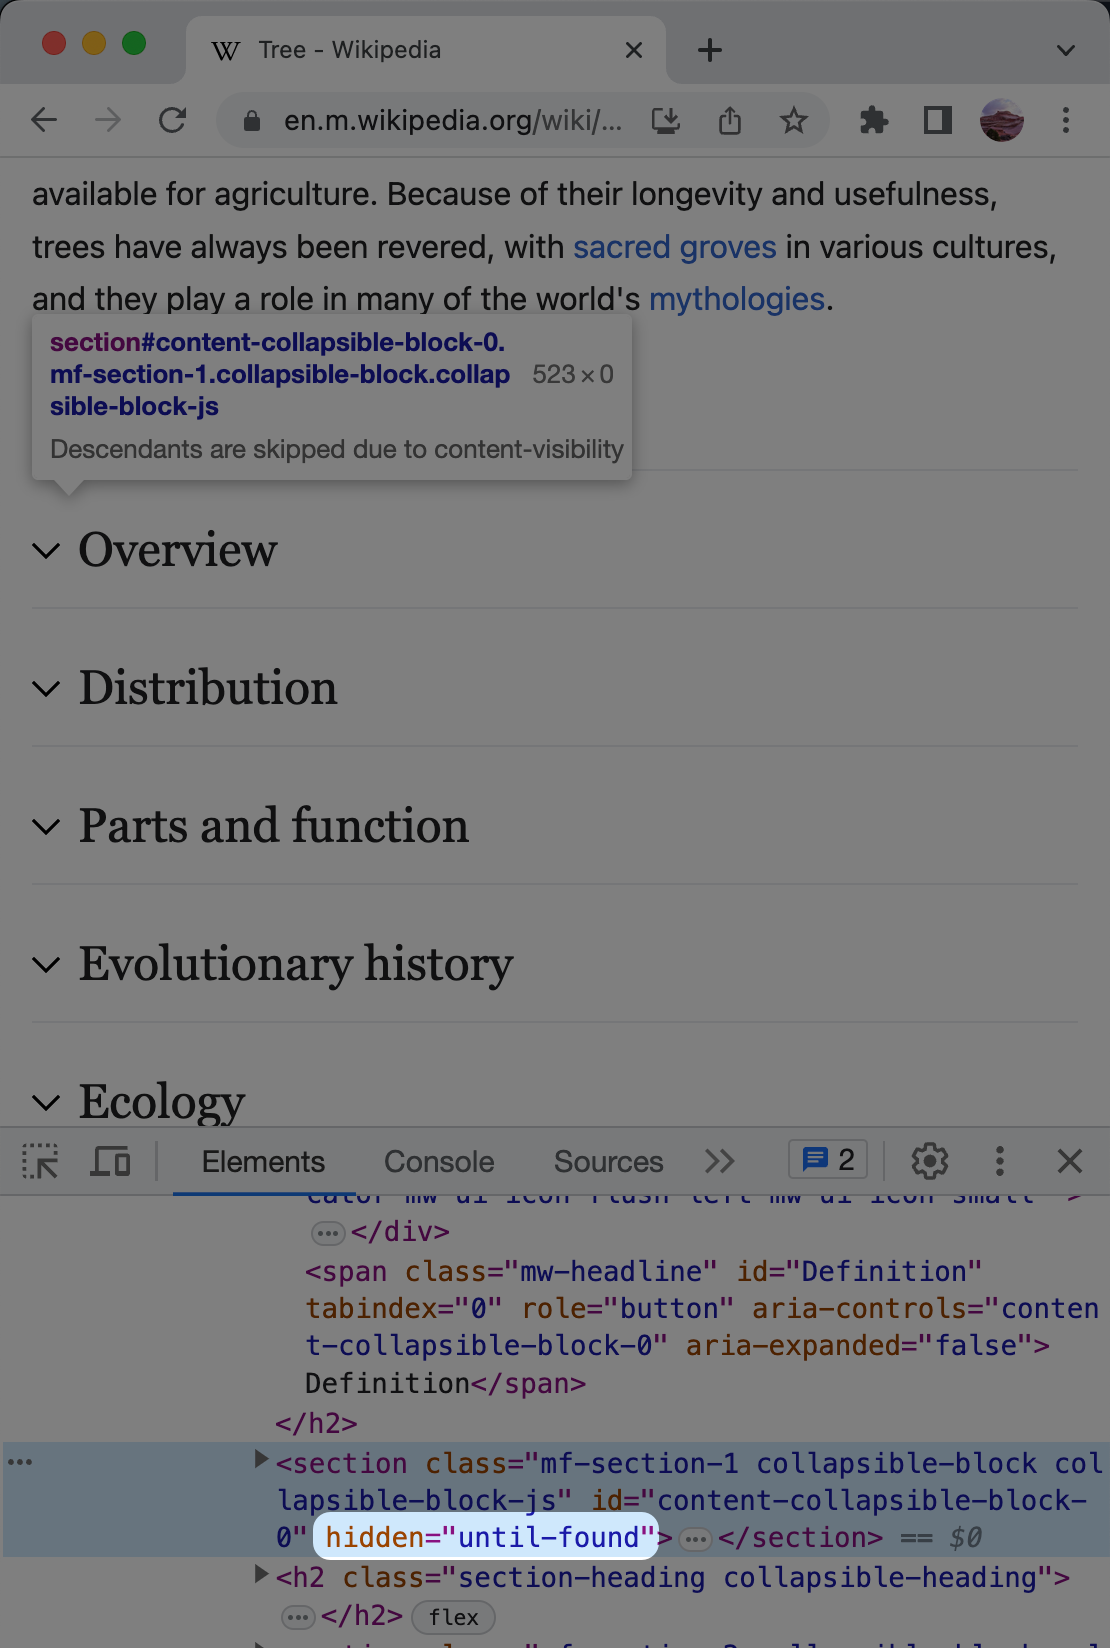
To minimize the effects of a large DOM size, you can hide certain elements by default with one of the following methods, effectively removing their rendering costs:
display: noneCSS stylehidden=until-foundHTML attribute
One practical approach for long pages with a lot of content involves collapsing and concealing the less popular sections, only revealing them when the user clicks on a section title. Wikipedia uses this technique on its mobile site, only showing the first section by default. It significantly reduces the overall rendering costs of long articles since most users don't read the entire content.
A more advanced technique involves using the
content-visibility: auto CSS
style to defer the rendering of off-screen elements. This approach has
much less
browser support and
is typically more challenging to implement well, but it has the
potential to gain popularity.
Conclusion
In summary:
- INP measures the responsiveness of clicks, keypresses, and taps on touchscreens to produce a visual update
- INP will become a Core Web Vital on March 2024, replacing First Input Delay
- Use real user monitoring to measure your INP and to determine its cause PageSpeed Insights is the easiest way to start
- Slow interactions are often the result of long tasks on the main thread
- Efforts to optimize INP need to consider each interaction's input delay, processing time, and presentation delay
Throughout this article, we've explored the significance of INP and various ways to optimize it. Armed with actionable tips, you now have strategies to improve your INP score, ensuring your website is more responsive and enjoyable for everyone.